
The Month of February is when the Bend, Oregon real estate market reaches slows down to it’s slowest pace of the year. This makes for a relatively inactive month in the Bend Housing Market. In February 2017 our weather was uncooperative, with lots of snow in town and colder temperatures for a sustained period of time. Let’s take a look how this effected the Bend Housing Market:
Bend Housing Market February 2017
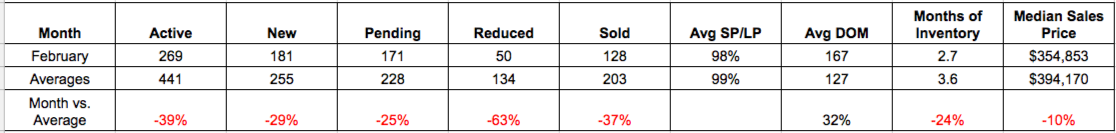
Months of Inventory
February 2017 wrapped up with an average of 2.7 Months of Inventory for Bend Homes. That represents a 24% drop from 2017 averages. The 2.7 number indicates a deficit in available Bend home inventory, and is consistent with what we’d expect given the heavy snowfall and intense winter experienced during this time. This indicates the Bend Housing Market in February 2017 favored the home seller, but it was close to being balanced between the home seller and home buyer. Browse Bend Homes >
Median Sale Price
The Median Sale Price for homes in Bend Oregon during the month of February 2017 was $354,853 which is down 10%, or $39,317 from 2017 averages.
Number of Days on Market
This tells us how long Bend homes remain as Active listings before the move to Sold status. The national average is 80 days on market. In February 2017, Bend Homes averaged 167 Days on Market. The higher than average number of days on market in Bend favors the buyer.
Understanding the Numbers
Click here to learn more about what each ratio means, why its an important measure for Bend Homes, and to understand how this calculation is made.
Bend Homes for Sale
Would you like to see the homes currently listed for sale in the Bend Oregon area?