
The team at All Bend Real Estate has compiled the data showing the 10 Year Trend for Median Sales Prices of single family homes in Bend (Oregon), and it’s time to share it. We’ve seen quite a bit of fluctuation over the past years (2007 through 2017), and the graph shows how the median sale price of homes dropped from its previous record in 2007 and 2008, into lows in 2010 and 2011, and a recovery from then through 2017 .
Bend Homes 10-Year Median Sales Graph (2007 through 2017)
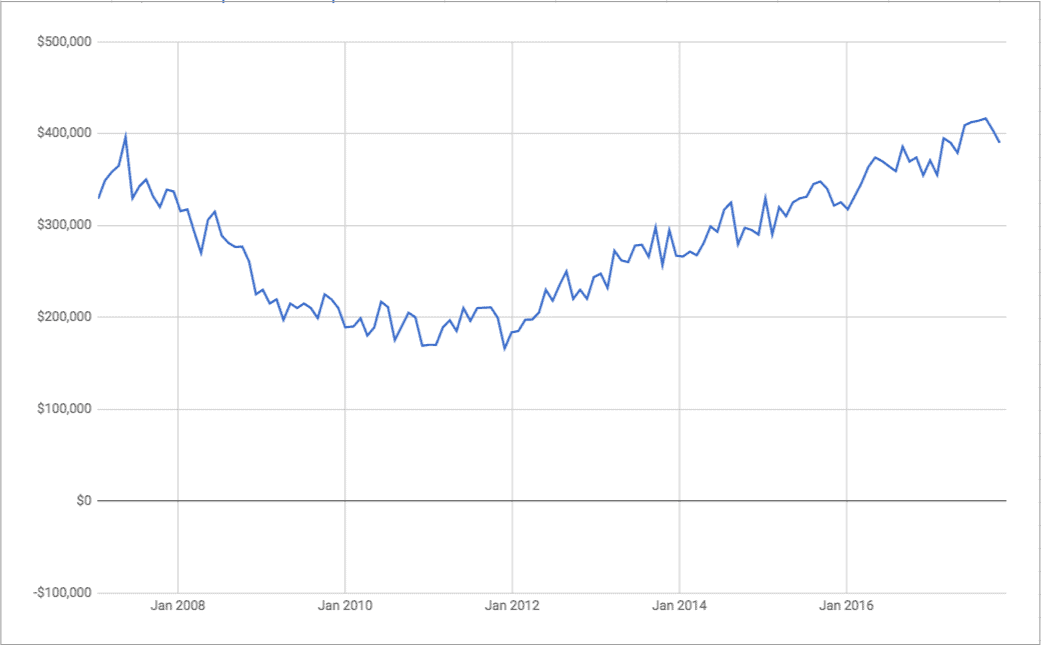
Bend Homes 10-Year Median Sales Price
From 2007 through 2017 we’ve experienced a 14.05% increase in the median sales price of single family dwellings in Bend, Oregon. The reason for the seemingly steady growth is the record prices experienced in 2007 and 2008 that were realized before the 2010 and 2011 decline in Bend real estate values. We’ve rebounded from that and surpassed it 2017.
Bend Homes Year-over-Year Median Sales Growth vs. National
Let’s overlay the Bend (Oregon) median homes sales data with the US National data to see how our local market is performing compared to the larger market.
Year Median Year-over-Year Change National (US) Median National Year-over-Year Change
2007 $345,597 $247,900
2008 $285,492 -17.4% $232,100 -6.4%
2009 $213,750 -25.1% $216,700 -6.6%
2010 $192,826 -9.8% $221,800 2.4%
2011 $190,535 -1.2% $227,200 2.4%
2012 $219,292 15.1% $245,200 7.9%
2013 $267,784 22.1% $268,900 9.7%
2014 $290,150 8.4% $288,500 7.3%
2015 $326,235 12.4% $294,200 2.0%
2016 $359,166 10.1% $307,800 4.6%
2017 $394,170 9.7% $322,000 * 4.6%
*National data for 2017 was not available at time of publication, so preliminary estimates were used.
Bend has realized 14.1% growth in median homes sale prices from 2007 to 2017, and 6 consecutive years where the median price has increased. Meanwhile the nation has realized 29.9% growth, and 8 consecutive years where the median price has increased (based on preliminary estimates for 2017).