Join us as we discus the Bend real estate trends during first quarter of 2022. We’ll dig into the actual data reported to help inform your home selling and home buying decisions based on Bend sales volume, median prices, cash sales, supply, and price per square foot. We’ll share 2+ years of data with you for all of these key metrics (additional data can be shared for active clients).
Median Price of Bend Homes (March 2022)
In March of 2022, the median price of Bend Homes reached another new high – the median for single family residence (SFR) homes reached $740,000.
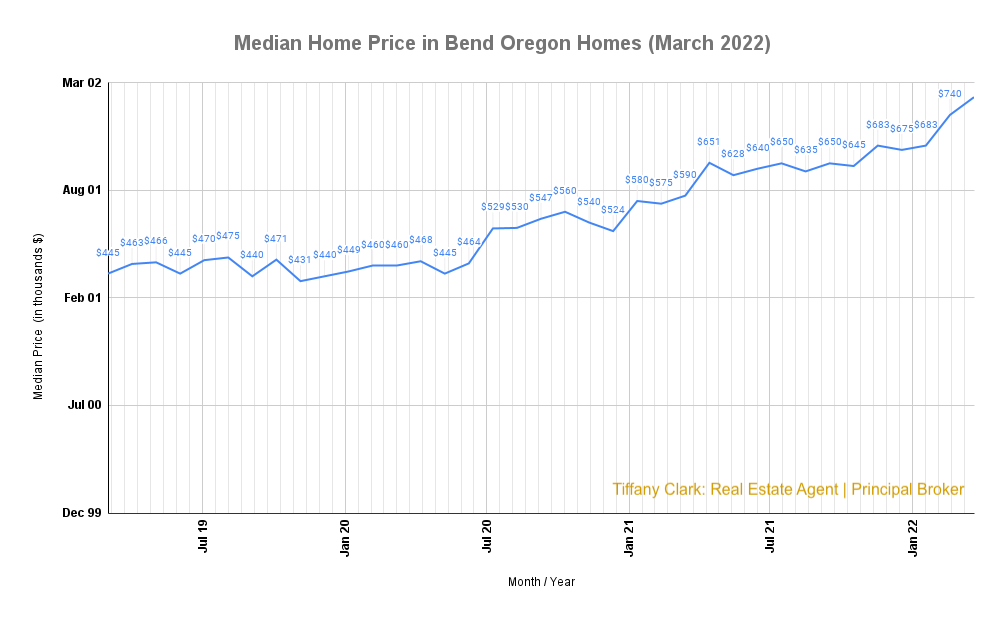
Looking at Year-over-Year data we can see that in March of 2021, just a year prior, the median price of homes in Bend (Oregon) was $590,000. In March 2022 that number reached $740,000. That growth represents a 25.4% increase in median home price for the Bend area in just one calendar year. For reference, from March 2020 to March 2021, the median home price increased by 28.3%. And the year preceding that (2019 –> 2020), the median prices increased by just 3.4%.
Number of Home Sales in Bend (March 2022)
For March of 2022, home sales topped out at 202 closed sales for the month. That number was up from February 2022 when 131 homes closed, and January 2022 when 131 closed.
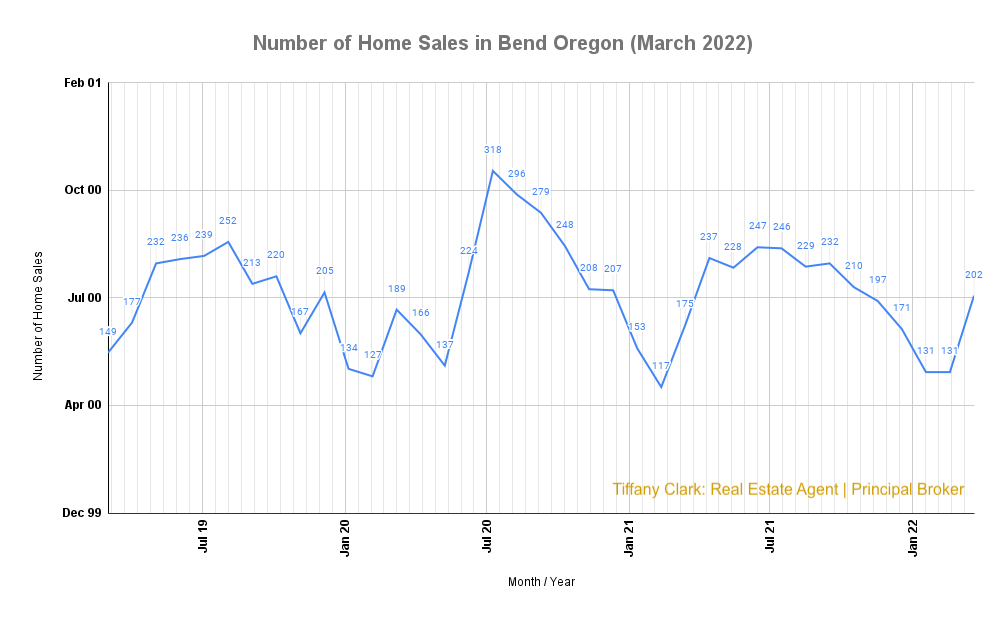
Looking at Year-over-Year data we can see that in the preceding year (March of 2021) 175 home sales during the month, equating to a 15.4% increase in homes sold year-over-year. In March 2022 that number reached $740,000. Note that the reported sales only counts the number of homes where sales closed during the calendar month.
Days on Market (March 2022)
Days on Market continues the amazingly low trend we’ve seen dating back to August of 2020. For March of 2020, the average days on market for homes in Bend is only 4 days. Translated, the day on market measure the total number of days a house remains in active listing status before going pending, sold, or contingent. With a number this low, it’s safe to assume that most sellers are opting for a 4-day offer review period to consider all offers.
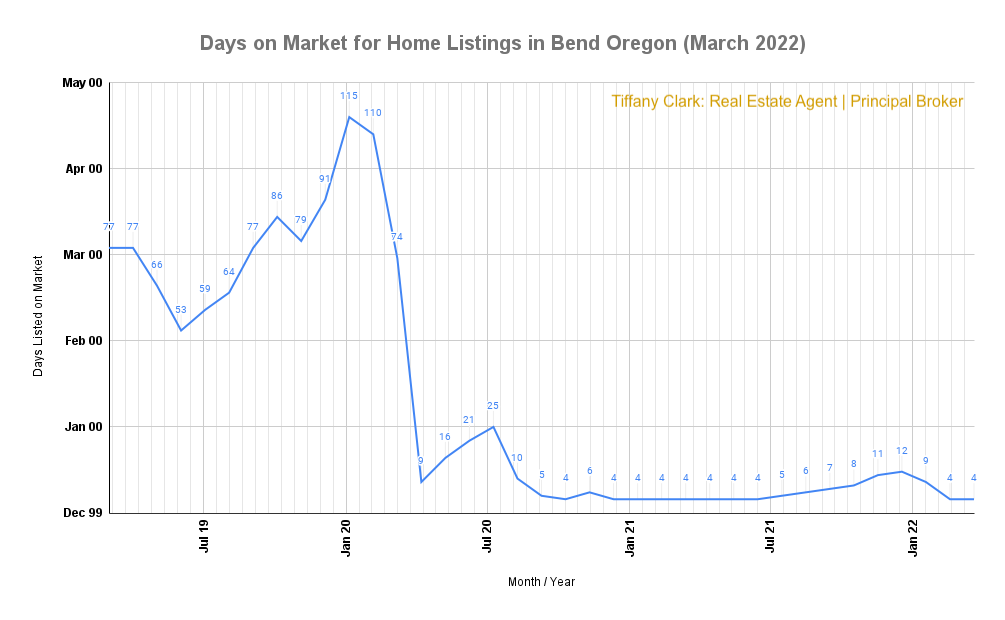
The main takeaway here is that Bend home buyers must be prepared to act quickly when a house meets their criteria. You could take this further an intuit that buyers must be ready to present strong and solid offers quickly, and without delay. As a principal broker at one of the largest real estate agencies in Central Oregon I can help you see properties early, and have compelling offers presented quickly for the homes you wish to pursue – please call me, or email me, so I can help you close the deal on a home.
Homes Selling for Cash (March 2022)
Cash sales, otherwise known as homes selling for cash and without a financing contingency, can be an important benchmark in determining the competitiveness of the home buying market. During March 2022, we can see that 45 homes were sold as cash sales (without a financing contingency), while 149 homes were sold with conventional financing (AKA. a mortgage). Translating those number into percentages, tells us that 23% of the homes sold in March 2022 were cash sales, and 77% were financed.
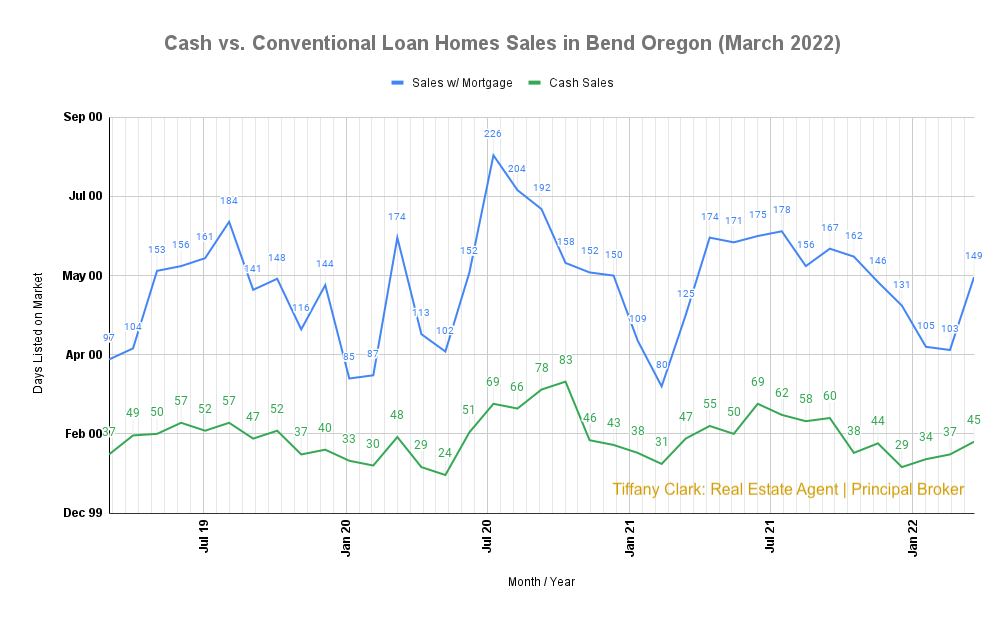
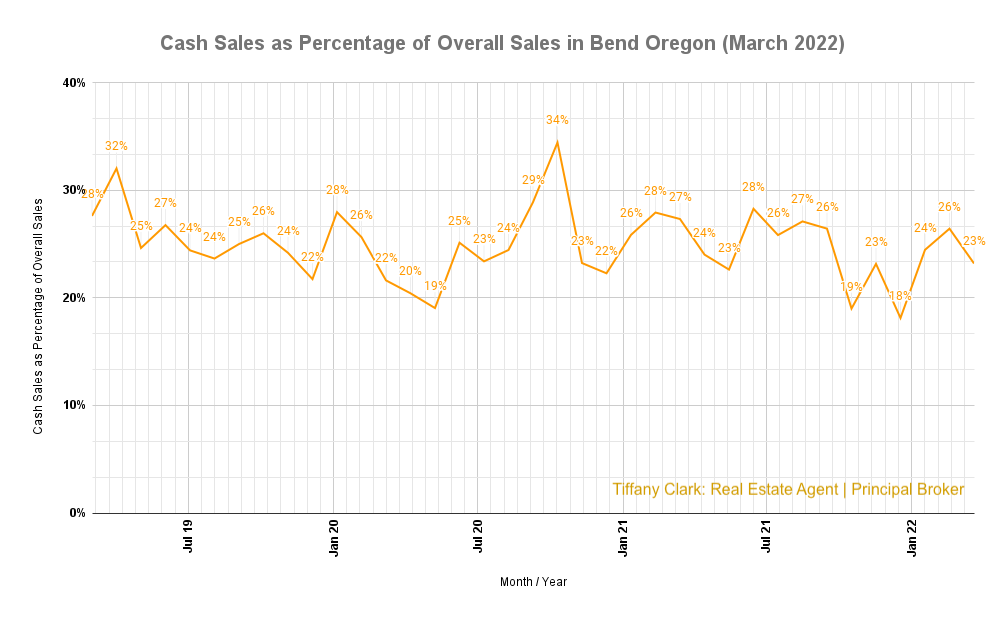
The 23% cash sales number, although down from recent record highs, is significant. This suggests that the Bend market has and continues to experience pressure to make home offers more compelling, less prone to complication in the closing process, and to stand out from the other offers where the additional complexities of closing with a mortgage can make an offer less attractive in the eyes of a seller. However, when we look at year-over-year data we can see that March of 2022 was down 4% from the cash sales in March 2021 when it accounted for 27% of sales, and up from March 2020 when it accounted for 22% of all home sales in Bend.
For those buyers interested in making a cash offer, I work with many lenders, one of which offers a product whereby qualified buyers can make a cash offer – please call me, or email me for details.
Home Inventory (March 2022)
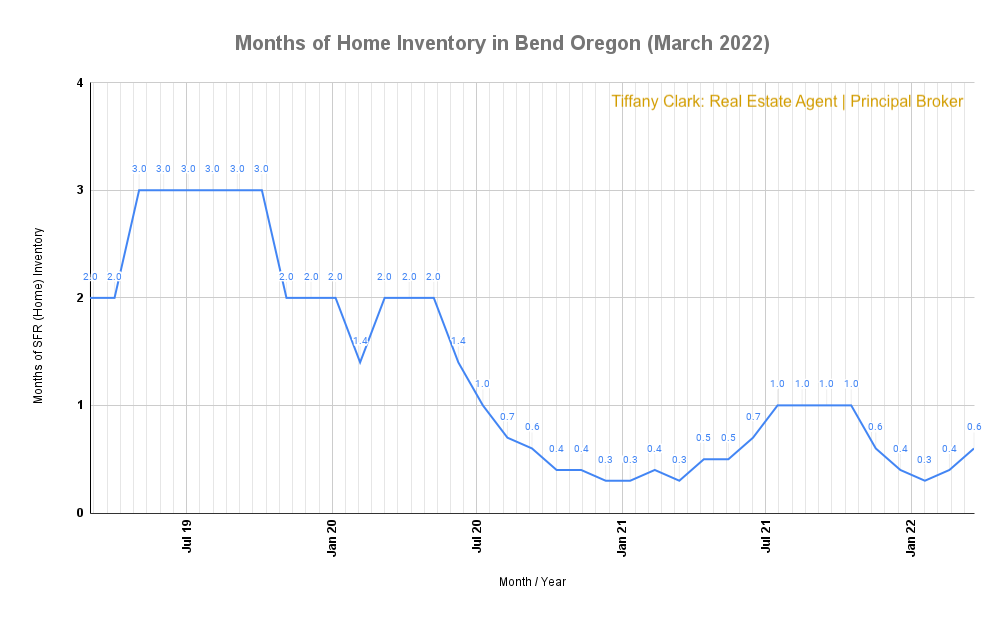
Months of Home Inventory tells supply story of the real estate market – the large the number the more homes for sale in the market, the lower the fewer homes which are available for purchase. A low number indicates homes indicates the demand for homes exceeds the supply, which is good for sellers. For March 2022, the months of home inventory reached just 0.6 (months). That’s equal to the 0.6 realized in March 2021, a sharp decline of 70% from the 2.0 months of inventory realized in March 2020 and March 2019.
Price per Square Foot (March 2022)
The Price per Square Foot metric provides a solid indication for the rise or decline of a real estate market. For March 2022, the price per square foot (PSF) reached an impressive $389. This is a median number for all sales across Bend, regardless of condition, neighborhood ,desirability, etc.More desirable neighborhoods will see significantly great price per square foot numbers, while less desirable neighborhoods will experience the reverse. The $389 / square foot number for March 2022 represents a 33.2% increase from March of 2021.
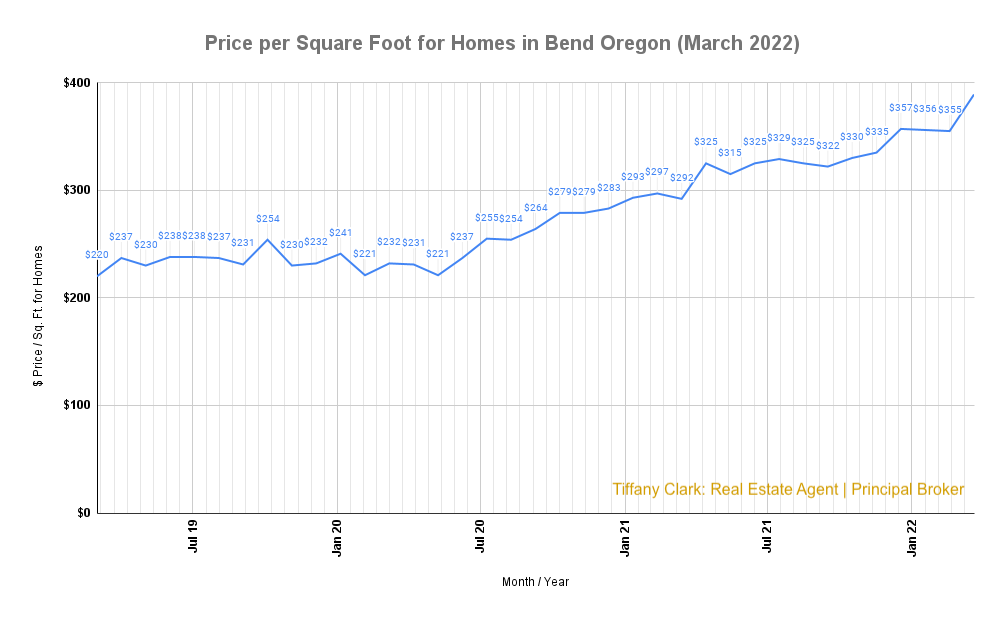
Similarly, March 2021 experience a 25.9% increase over the same month in 2020. Meanwhile 2020 saw slower growth, with only a 5.5% increase in price per square foot over 2019. The takeaway here is that Bend has experienced increased price growth in the past 2 years.
Takeaways from Bend’s Real Estate Trends (March 2022)
From the March 2022 data, we can ascertain that the Bend real estate market continues to perform strongly evidenced by:
- Low inventory indicating demand exceeds supply (Data: 0.4 months of inventory)
- Price per square foot continuing to increase (Data: $389/square foot)
- Days on market remains very short (Data: 4 days)
- Cash sales remaining strong and steady (Data: accounts for 23% of sales)
- Home sales continue to be hold strong (Data: 202 homes sold)
- Median price reached new highs (Data: $773,000)
Please call me, or email me, so we can discuss getting your home listed for sale.
